Information Technology Project Management (...only images)
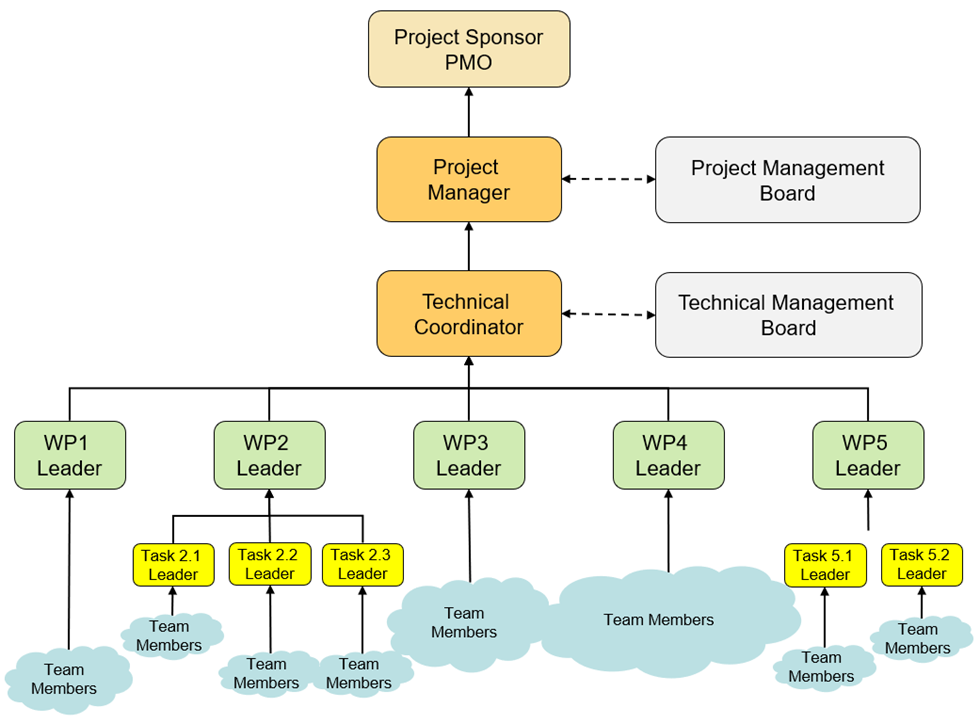
Fig 1.4 Project Reporting Structure
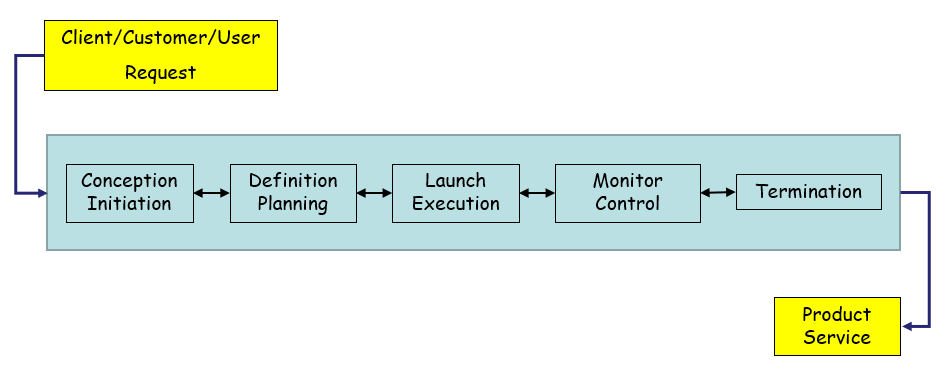
Fig 1.5 Generic Project Phases
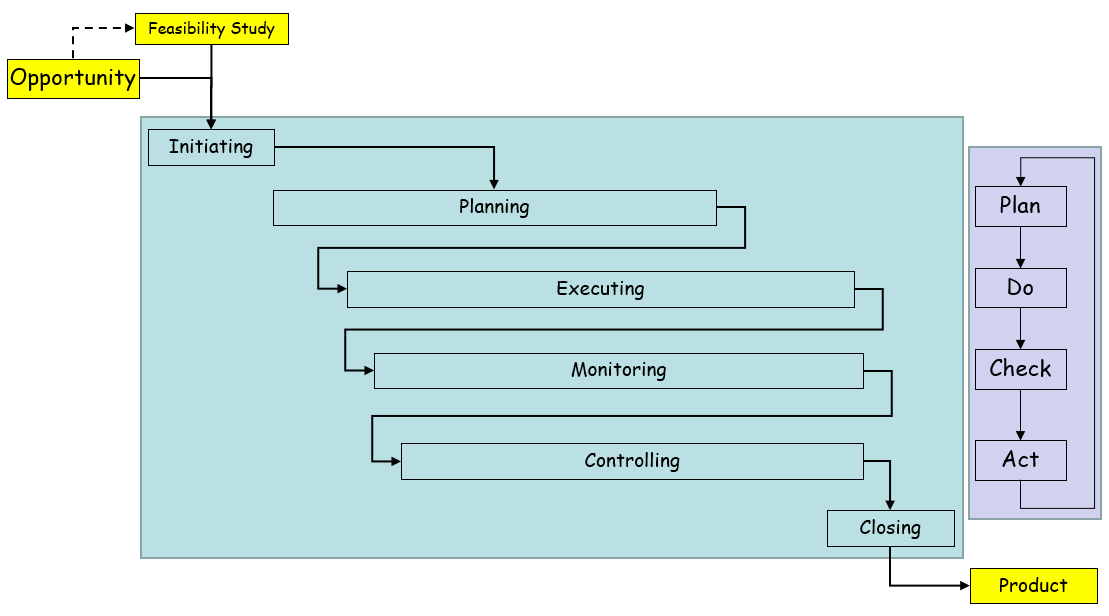
Fig 1.6 Overlapping Project Phases
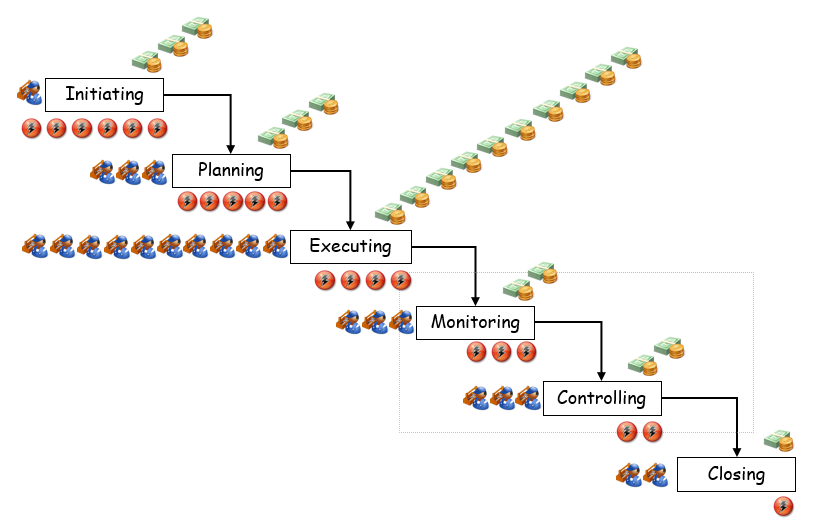
Fig 1.7 Risk in Relation to Cost and Workload
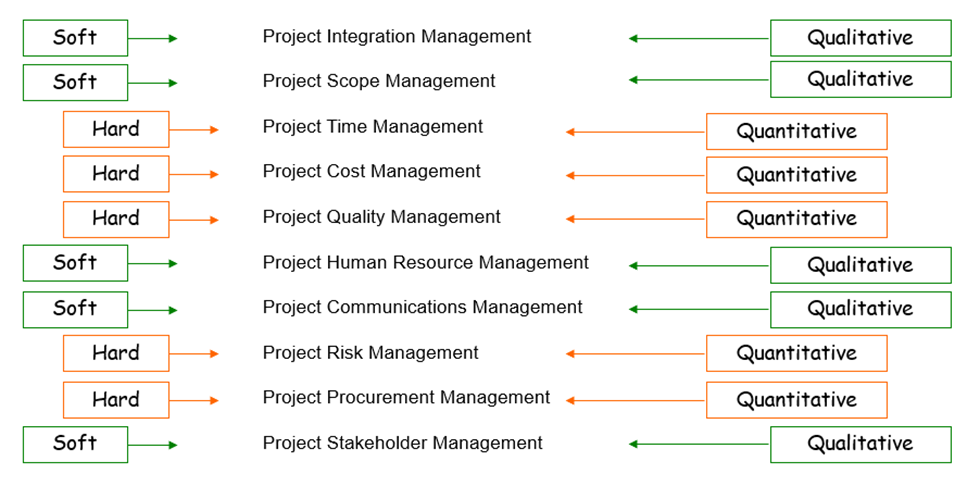
Fig 1.9 Project Management Skills Breakdown
Fig 2.1 Systems View of Organization of Project View
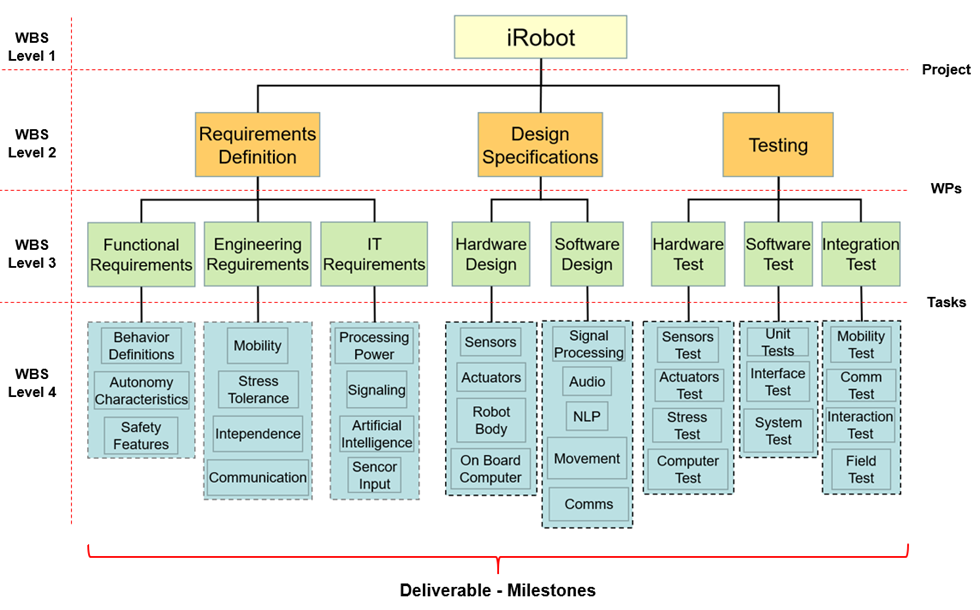
Fig 2.2 Work Breakdown Structure
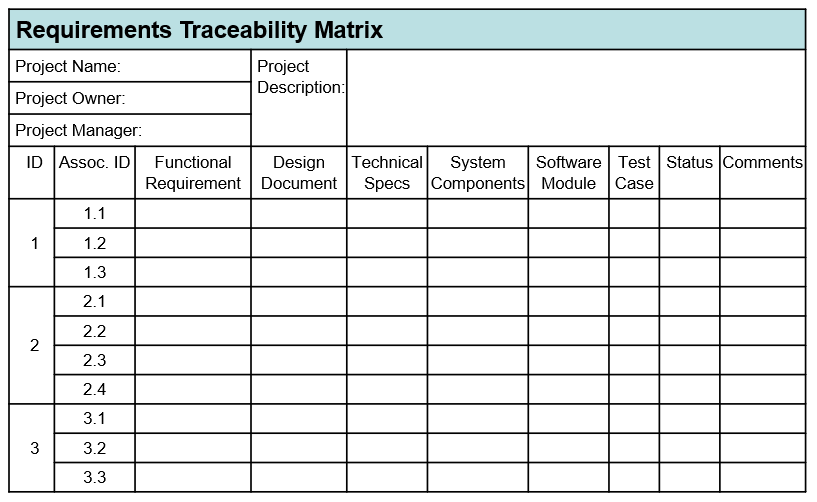
Fig 2.3 Traceability Matrix
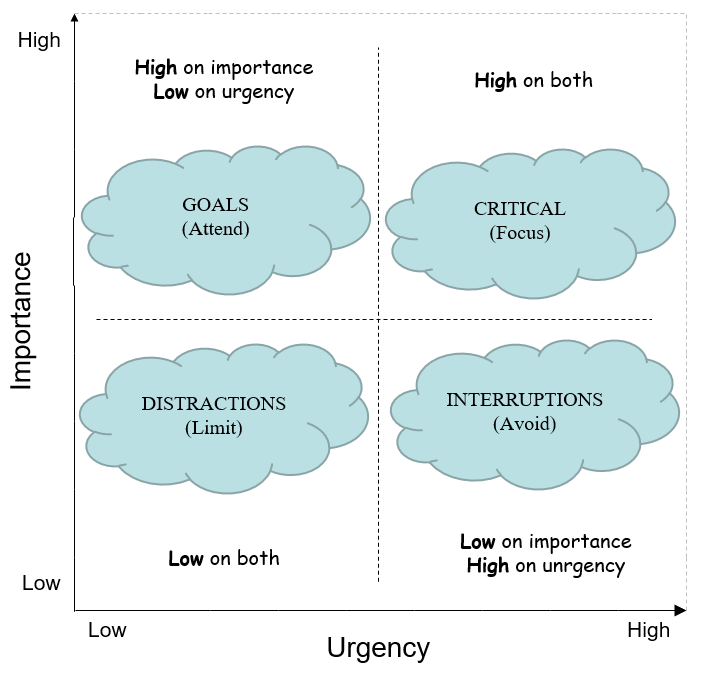
Fig 2.4 Urgency vs Importance Matrix
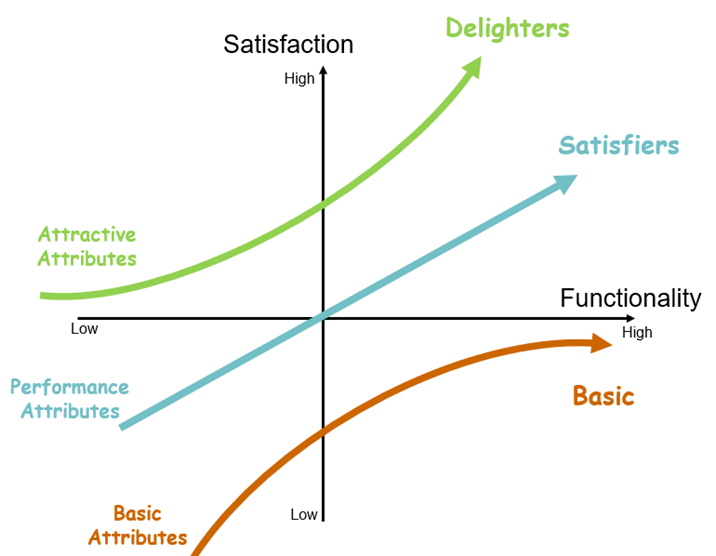
Fig 2.5 Kano Model
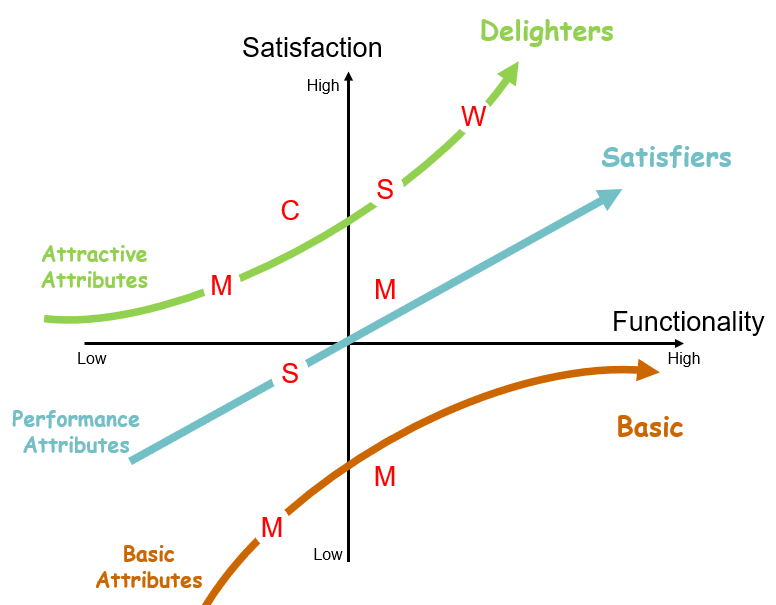
Fig 2.6 Combination of MoSCoW and Kano Models
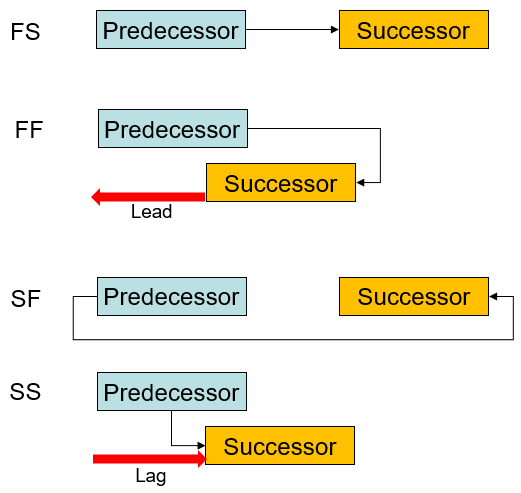
Fig 2.7 Relation Types in Precedence Diagrams
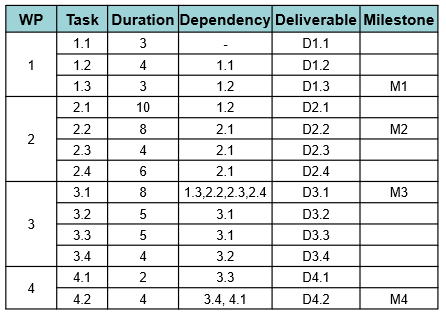
Fig 2.8 Relation Types in Precedence Diagrams Case
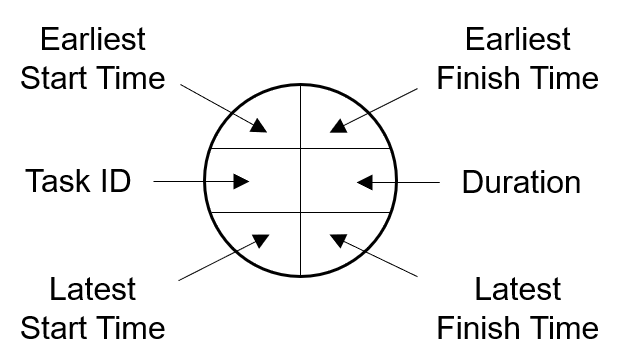
Fig 2.9 PERT cell
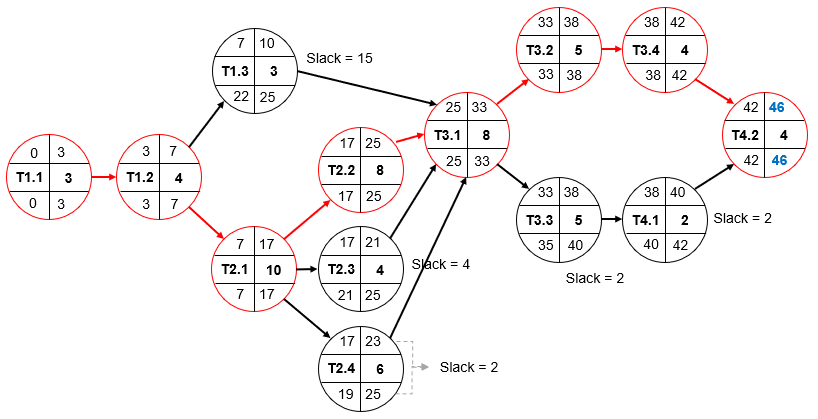
Fig 2.10 Critical Path
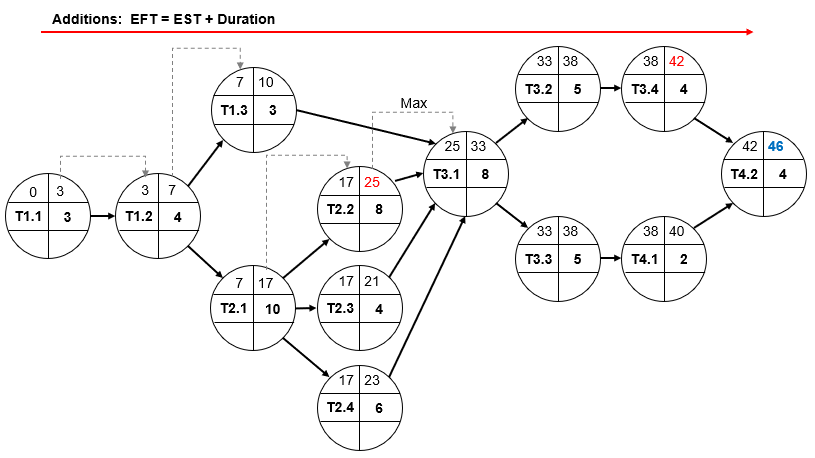
Fig 2.11 Forward Pass
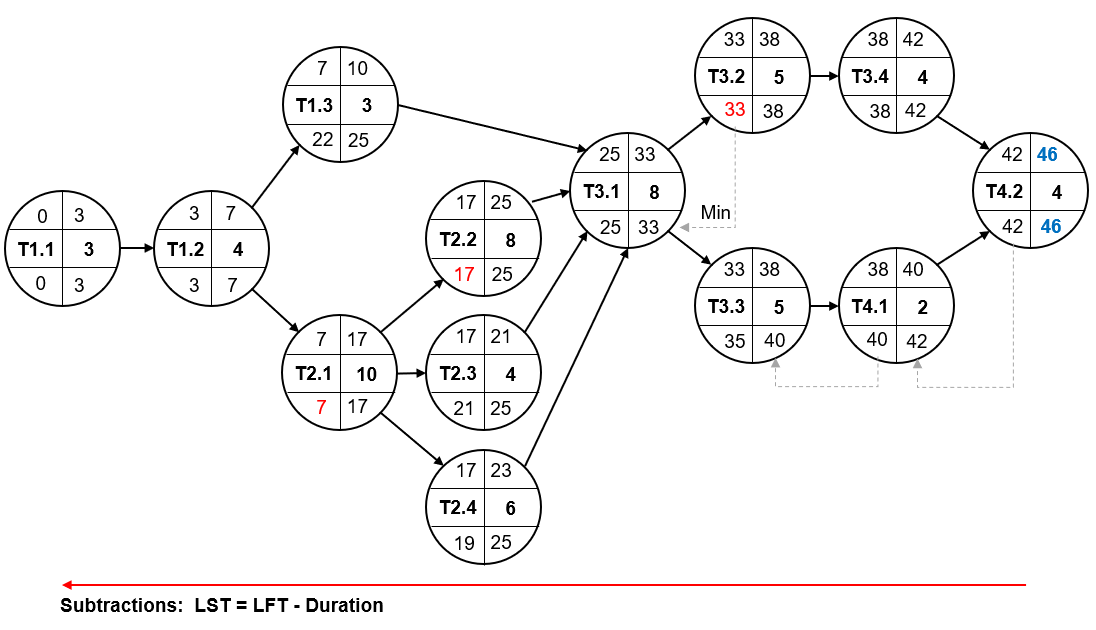
Fig 2.12 Backward Pass
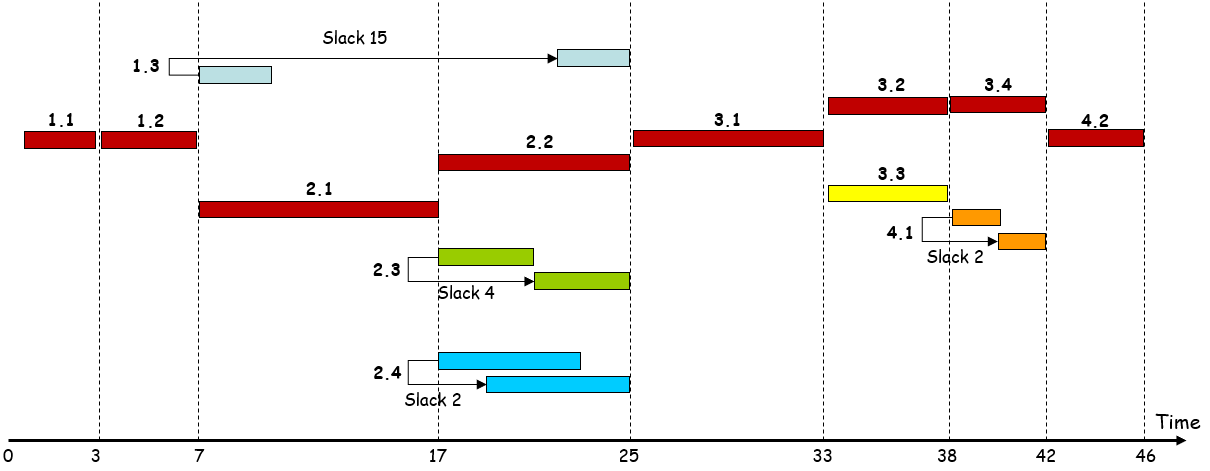
Fig 2.13 Relation Types in Precedence Diagrams
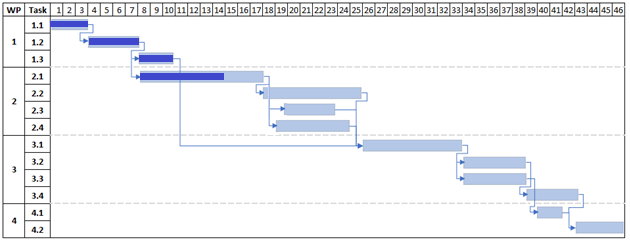
Fig 2.14 Gantt Chart
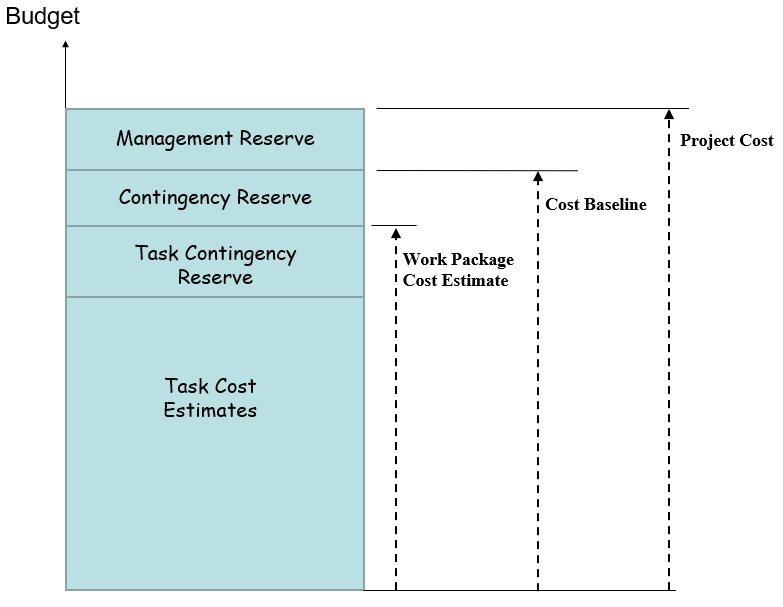
Fig 3.1 Project Budget Components
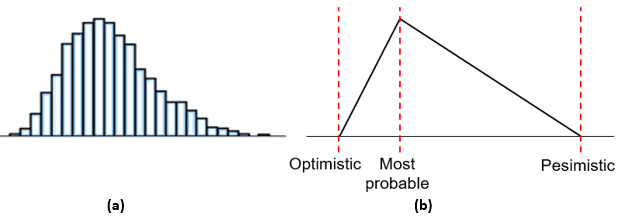
Fig 3.2 Normal and Triangular Distributions
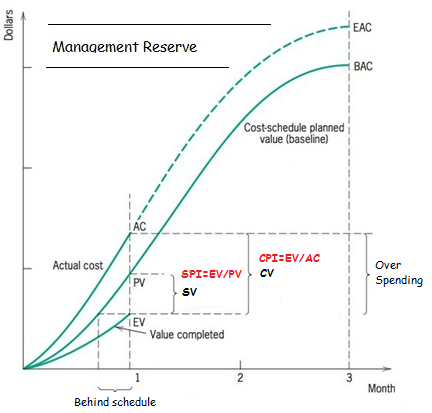
Fig 3.6 Earned Value Analysis
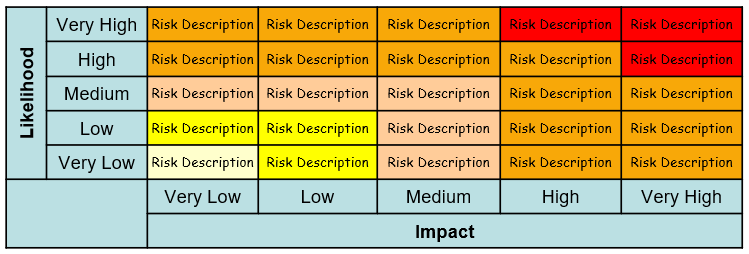
Fig 3.7 Likelihood and Impact Matrix
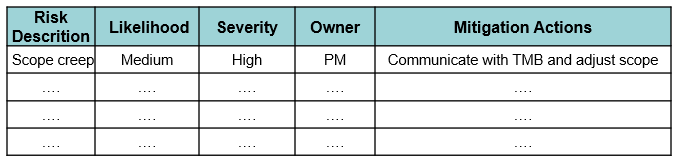
Fig 3.8 Risk Register
![]()
Fig 4.1 Combining Transactional and Transformational Leadership Styles
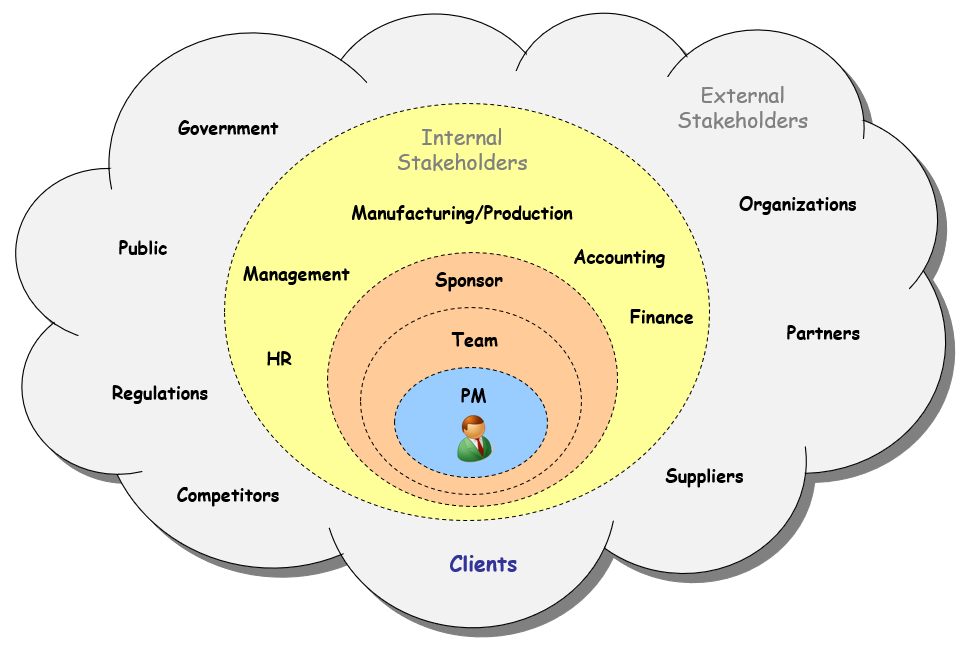
Fig 4.2 Project Stakeholders from a Leaders Perspective
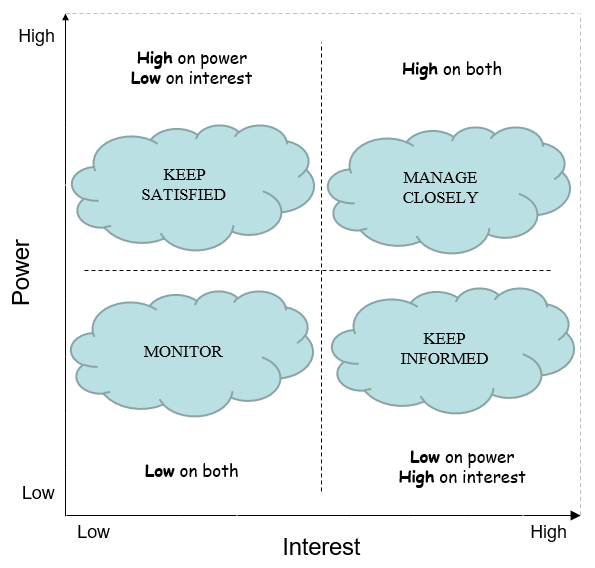
Fig 4.3 Project Stakeholder Power Interest Grid Classification
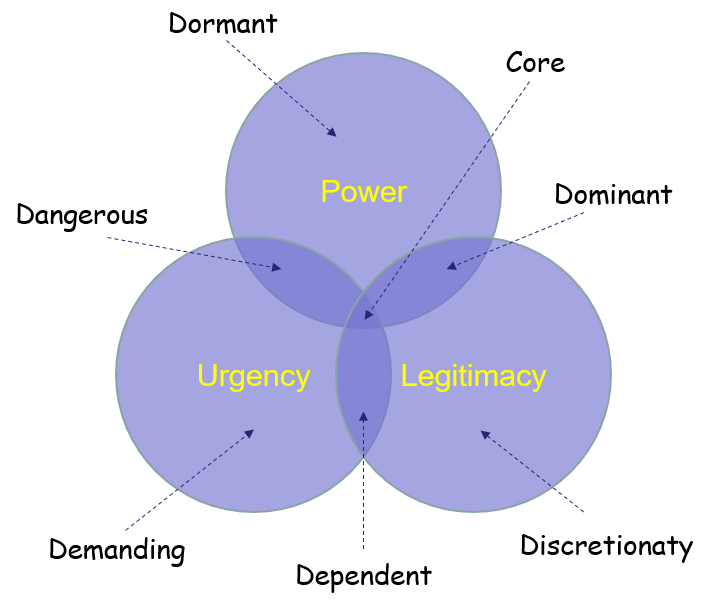
Fig 4.4 Project Stakeholder Salient Model
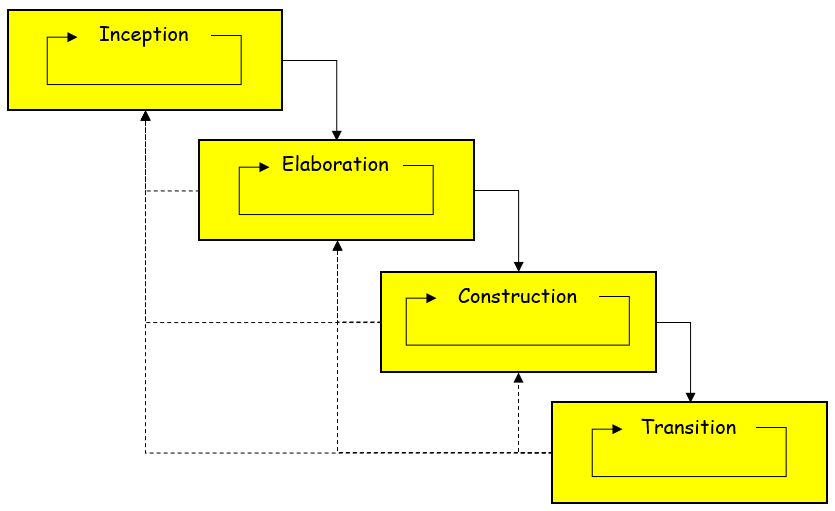
Fig 5.2 Unified Process Iterations
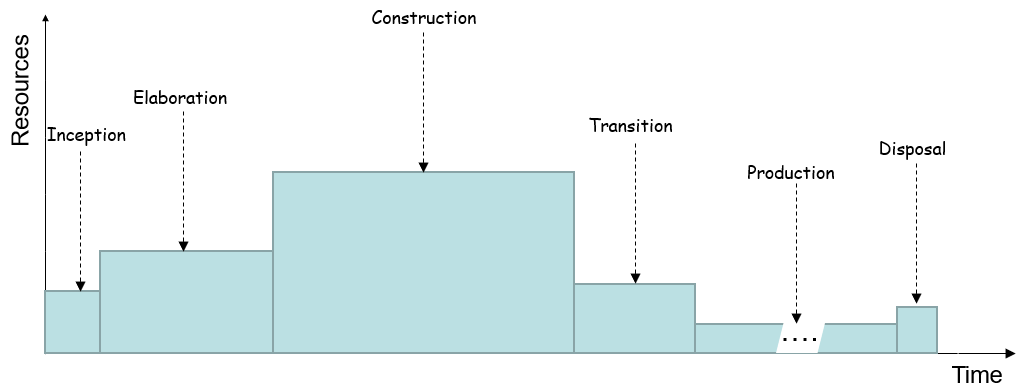
Fig 5.3 Resources Distribution in Unified Process Phases
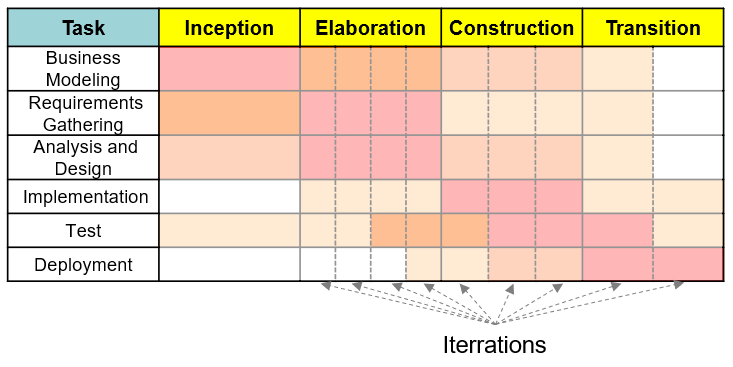
Fig 5.4 Workload Distribution in Unified Process Phases
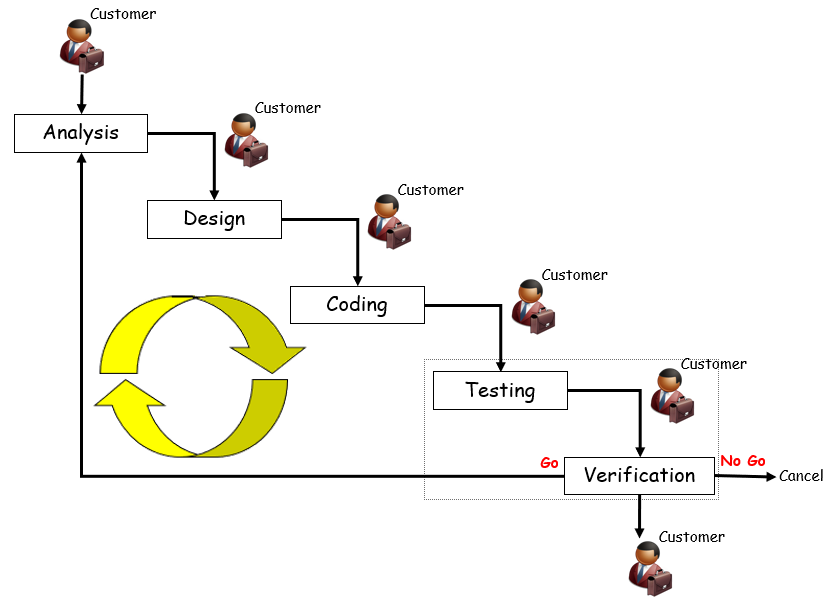
Fig 5.5 The Agile Process
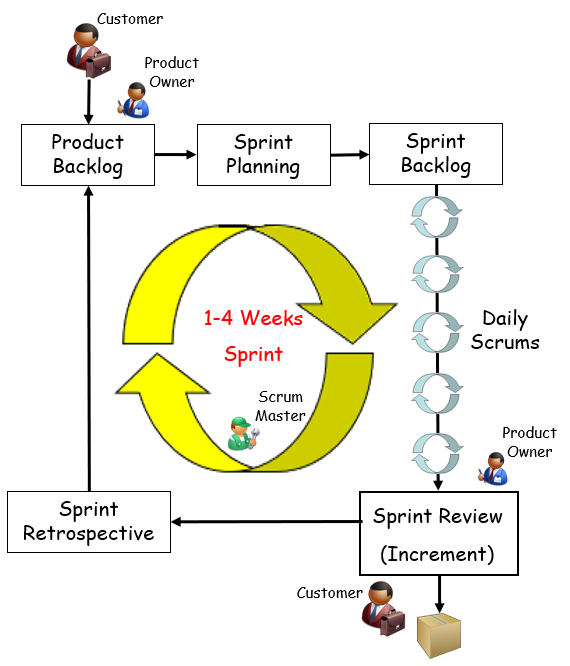
Fig 5.6 The Scrum Framework
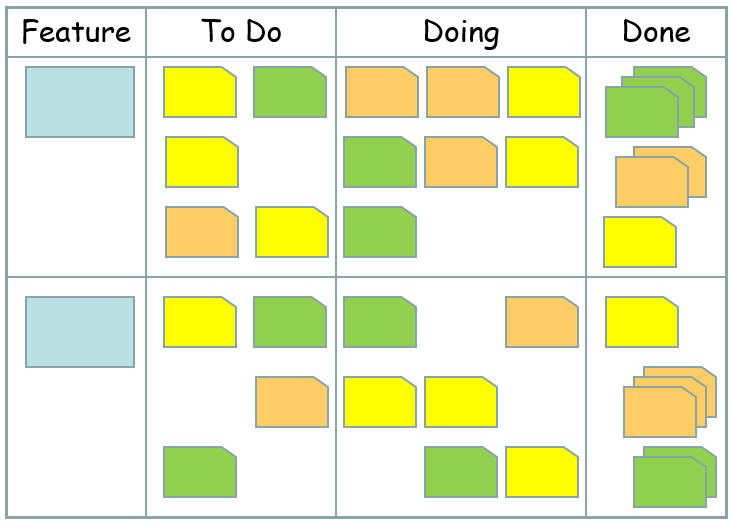
Fig 5.7 Sprint Task Board
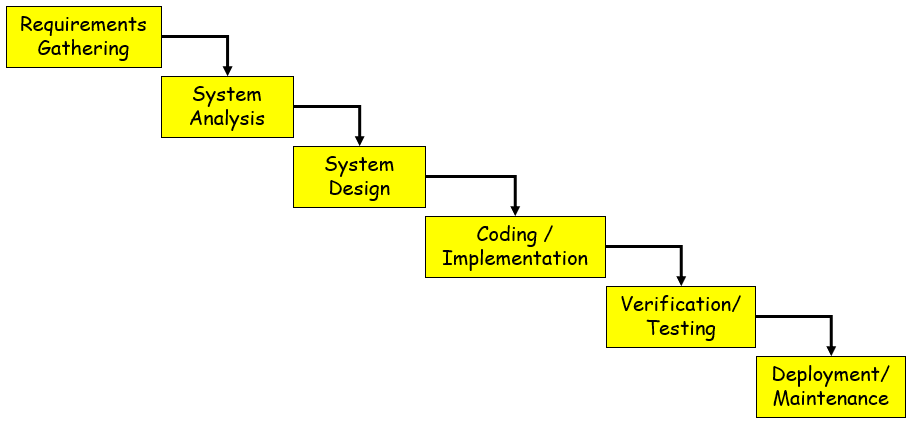
Fig 5.8 Waterfall Model
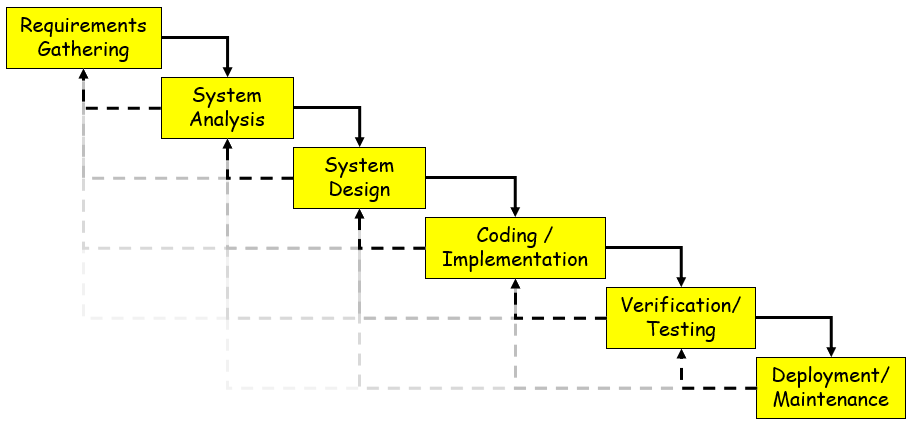
Fig 5.9 Waterfall Model With Feedback
![]()
Fig 5.10 Waterfall Model With Overlapping Phases (Sashimi)
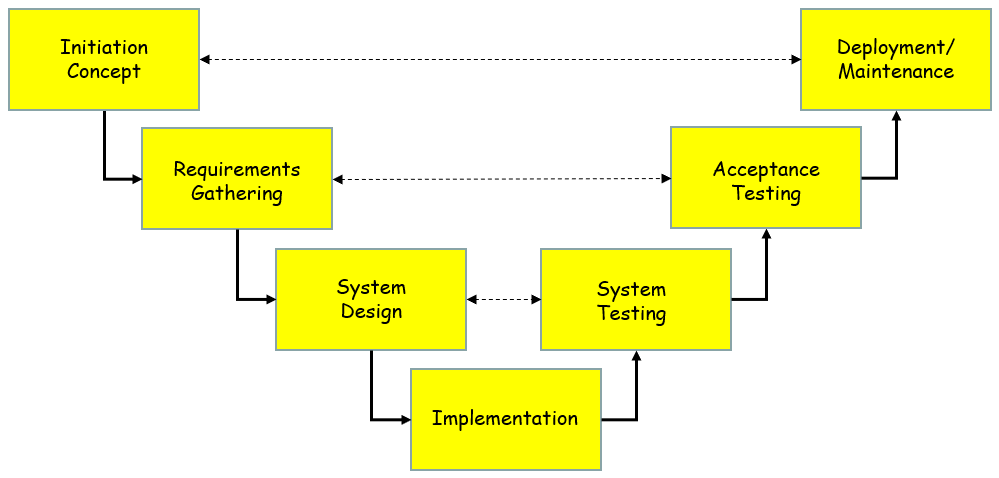
Fig 5.11 V-Model
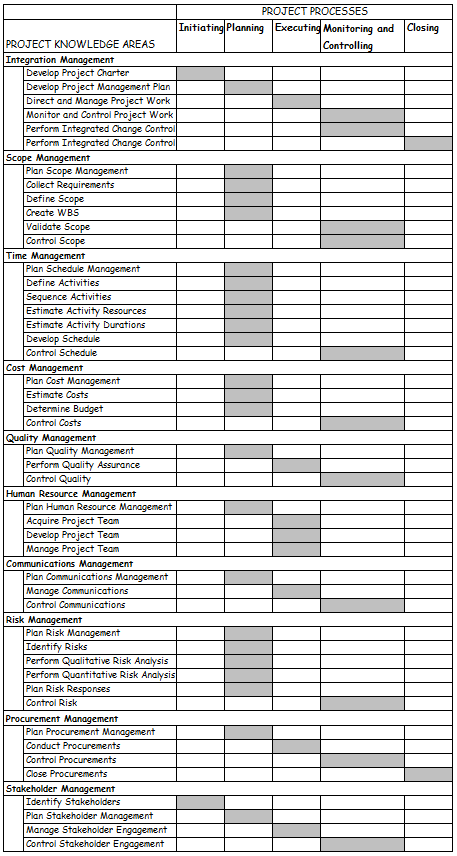
Fig 6.1 PMBOK Phases
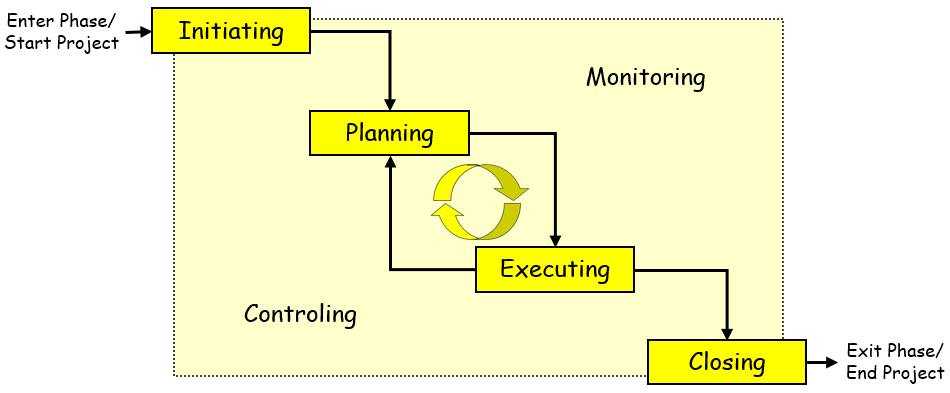
Fig 6.2 PMBOK Process Groups
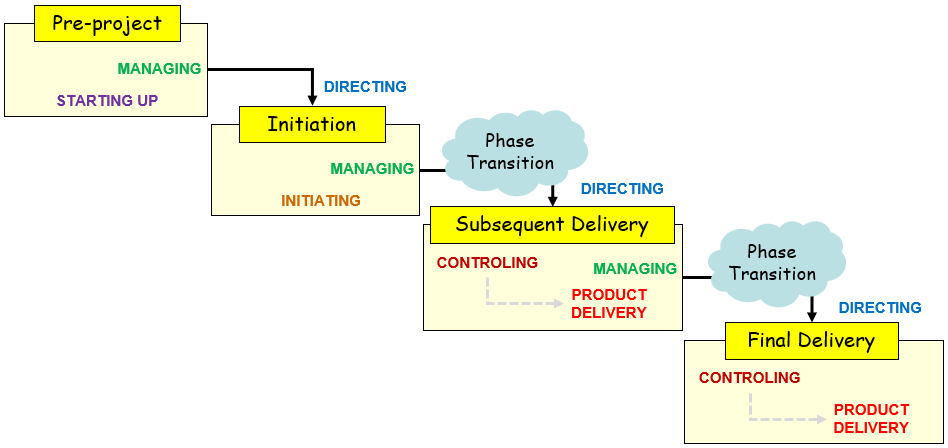
Fig 6.3 The PRINCE2 Model Process
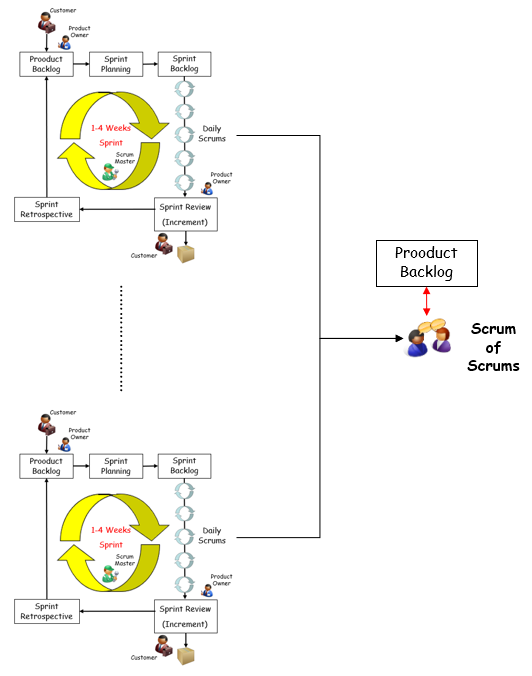
Fig 6.5 Scrum of Scrums
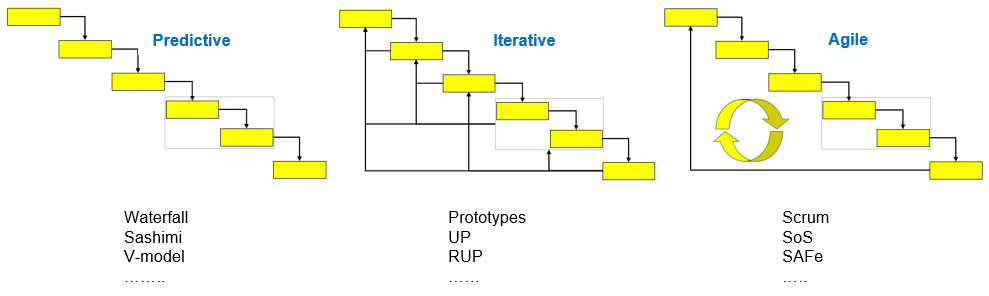
Fig6.6ProjectManagementMethodologies